case study
Weather Dashboard
Project Information
- Category: Data Visualization / IoT
- Tool: Power BI
- Source: Live Weather API
- Features: Real-time Sync, Forecasting
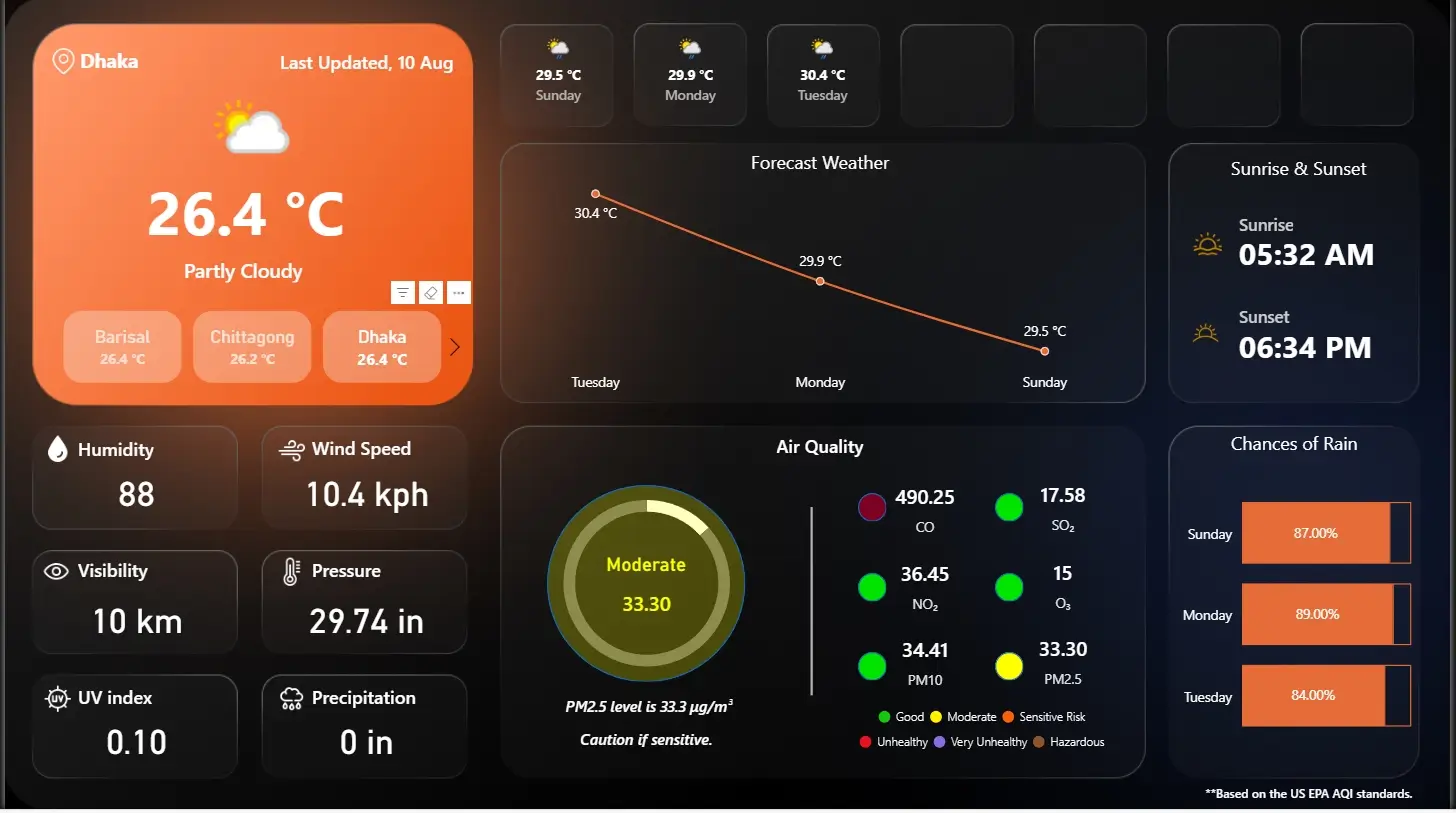
Real-time Weather Analytics
Delivering live weather insights through a Power BI dashboard designed for automatic daily refresh, integrating temperature, humidity, and forecasts into one interactive interface.
Situation
Climate conditions vary constantly, making quick access to accurate information essential. Traditional updates are often scattered across sources or delayed, hindering timely decision-making for events or travel.
Task
The goal was to create a centralized dashboard that auto-updates and consolidates all critical weather metrics—temperature, wind, precipitation, and 7-day forecasts—into a single, easy-to-read view.
Action
The dashboard was engineered with the following key capabilities:
Real-Time Monitoring
Tracks current temperature, highs/lows, humidity, and wind speed for immediate situational awareness.
Predictive Analysis
Visualizes precipitation probability and 7-day forecasts to aid in forward-looking planning.
Interactive filters allow users to drill down by location and date, comparing historical patterns to identify trends quickly.
Result
The Weather Dashboard delivers reliable, real-time data, saving time by consolidating scattered information. It empowers users—from event planners to casual observers—to make informed decisions based on the latest climate metrics.